How to master Jira epic progress reports for data-driven decisions
Share on socials
How to master Jira epic progress reports for data-driven decisions

Wilson Ong
Published on 27 August 2024
9 min read

Wilson Ong
Published on 27 August 2024
9 min read
Jump to Section
Jump to section
Why are accurate Jira epic progress reports so important?
Using Jira's built-in epic report and epic burndown report
Using Jira's built-in epic burndown report
Track progress across multiple epics with Hierarchy for Jira
Accurate reporting means better product decisions
Explore our favourite ways to track epic progress in Jira that go beyond basic metrics, empowering you to make data-driven product decisions with confidence
Making good product decisions is challenging if you lack visibility into your team's progress.
While Jira is extremely powerful, its built-in reporting features can be limiting.
Using the number of issues completed to track the progress of epics means you never know whether an epic is a week or a month away from release. Looking for a more reliable solution? Our blog shows you how to get more accurate insights with epic progress reports.
Relying solely on the number of completed issues to track epic progress often leaves you guessing whether an epic is days or weeks away from completion. So, if you’re looking for a more reliable, accurate, and practical solution for reporting, you’re in the right place.
In this blog post, we'll explore how to gain more accurate insights using enhanced epic progress reports in Jira. Let's dive in!
Why are accurate Jira epic progress reports so important?
Tracking Jira epic progress based on completed story points or time spent can be challenging. While it's relatively simple to calculate progress by counting completed issues, this method can be misleading when using estimates.
Consider this example:
- One issue is estimated at 1 story point, another at 10 story points.
- If one out of two issues is complete, Jira shows the epic as 50% done.
- However, if the completed issue was the smaller one (1 story point), the actual progress is only 10%.
This discrepancy also occurs with time estimates. A story estimated at one hour is treated the same as one estimated at eight hours.
The problem compounds when assessing progress across multiple epics. These inaccurate calculations cascade, distorting your view of the overall project or release progress.
For more precise insights into epic progression, a more granular tracking approach is necessary.
Fine-tune your progress tracking with Jira's built-in epic report and epic burndown report
One way to track epic progress based on story points or time spent is to use Jira's built-in epic report feature.
This lets you select any epic or epic link and track the total number of story points completed or total time logged. It gives you an indication of how far away your epic is from being completed based on the progress of its child issues.
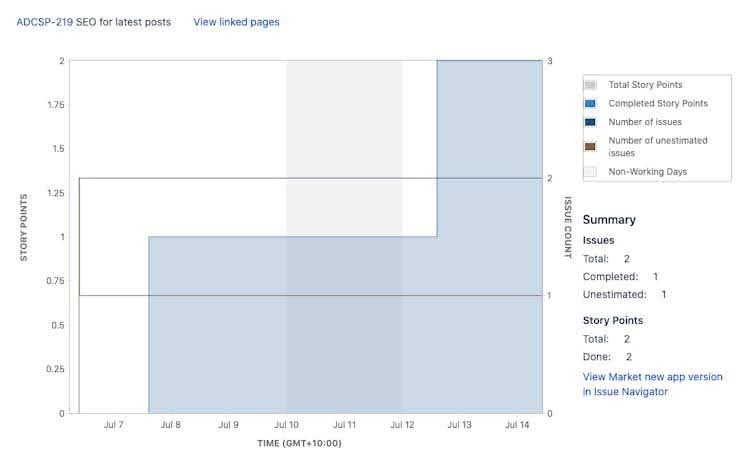
This is a useful report if you don't have many epics, as you can see exactly how much of your epic has been completed and how much work is left to do.
However, if you want to track the estimated progress of multiple epics as a group, it might not be enough. Why? Because Jira's epic report only lets you track the progress of one epic or epic link at a time.
Using Jira's built-in epic burndown report
One method to track epic progress based on story points of time spent is Jira's built-in epic burndown report. This feature allows you to:
- Select any epic or epic link.
- Track the total number of completed story points.
- Monitor total time logged.
- Gauge how close an epic is to completion based on its child issues' progress.
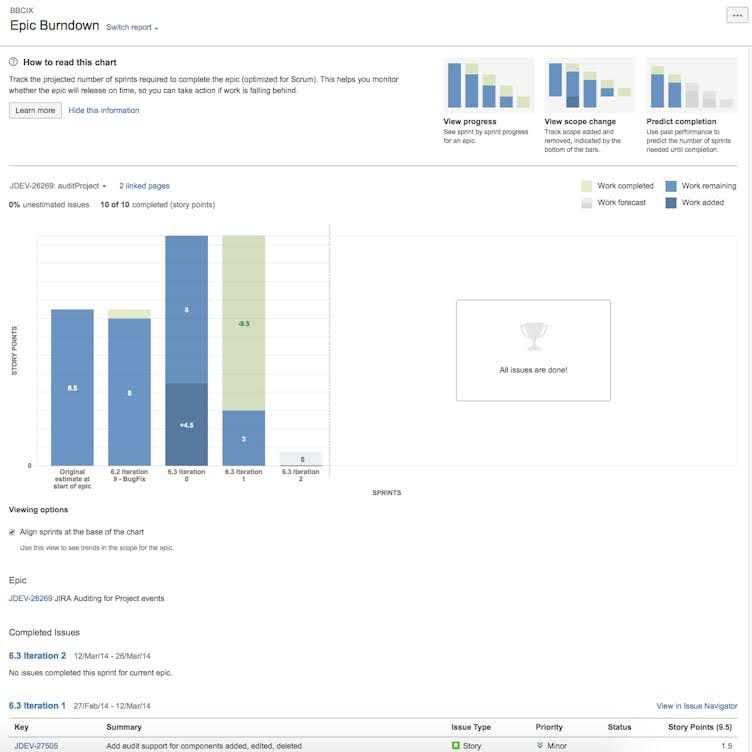
The epic burndown report is particularly useful when managing a small number of epics.
It provides a clear view of the work completed and the work remaining for each epic and even allows you to forecast how many sprints will be required to complete an epic or a set of epic links.
However, this tool has limitations when tracking multiple epics simultaneously:
- The report only allows tracking of one epic or epic link at a time.
- It doesn't provide a consolidated view of progress across multiple epics.
In short, the built-in epic Burndown Report may not be enough for teams managing numerous epics or needing a comprehensive overview of multiple epic progressions.
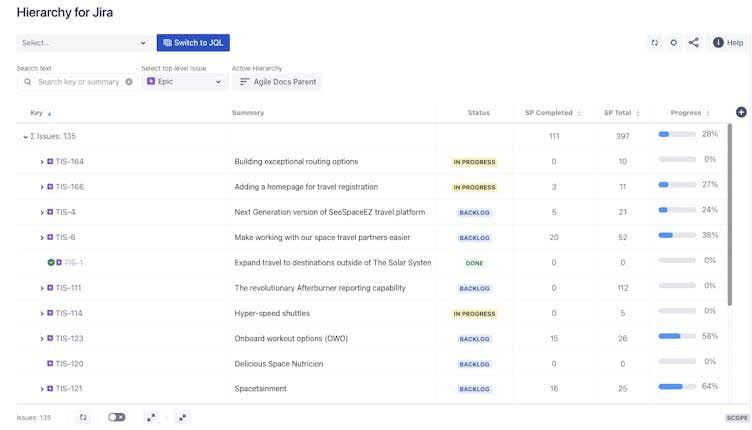
Track progress across multiple epics with Hierarchy for Jira
An alternative way to accurately calculate the completed percentage of your epics is by using Hierarchy for Jira.
Our Jira app lets you create an estimate tree, which rolls up your estimates from the smallest sub-task, all the way up to entire projects or filters.
This means you can effortlessly see how far along each epic is based on the percentage of story points completed or time logged.
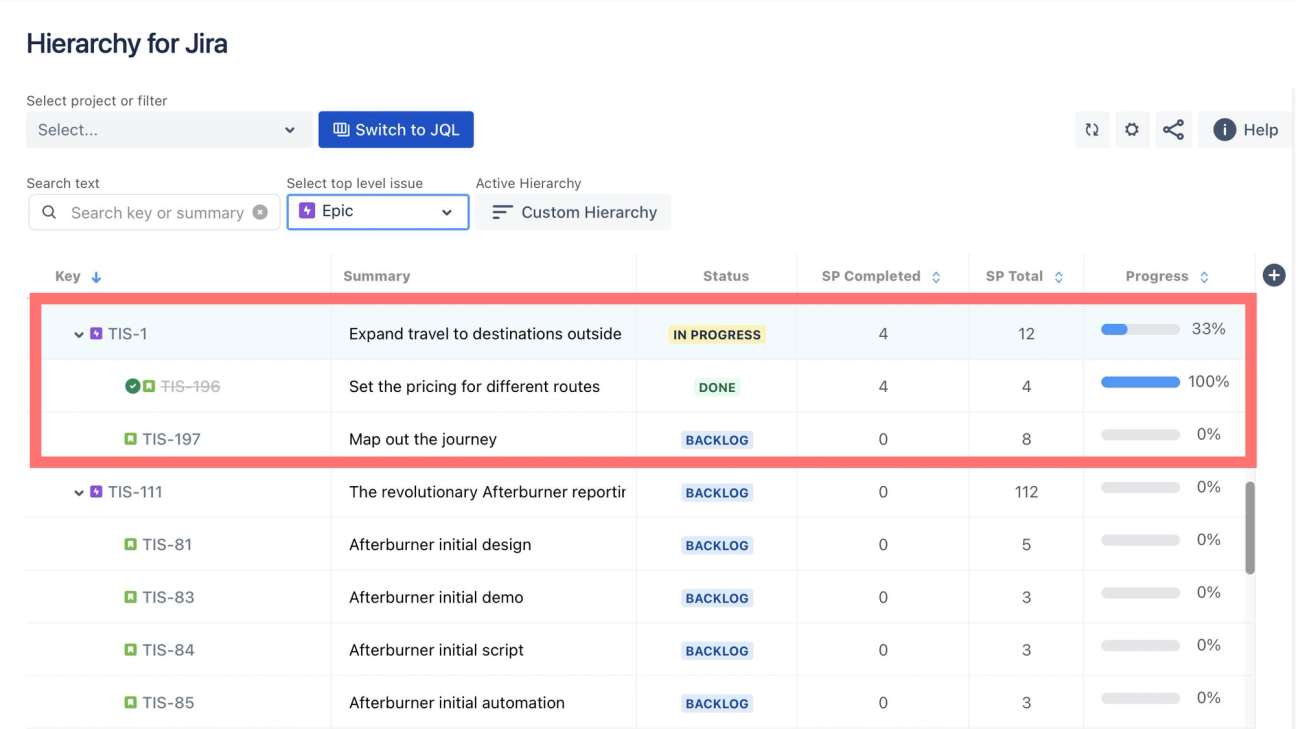
Unlike Jira's built-in epic report and epic burndown report, Hierarchy for Jira allows you to track the progress of multiple epics and epic links on a single page.
What's more, you'll get a handy tree view to help you visualise how every part of your project fits together.
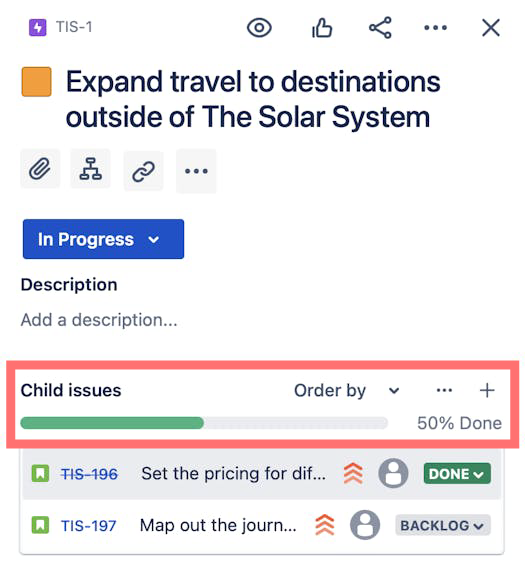
In the example above, the epic TIS-1 contains two stories.
One is complete; the other is in progress.
If you were calculating gain in terms of the number of issues completed, it would be 50% complete.
However, if you examine the stories and epics more closely, you'll see a very different picture.
The parent epic, TIS-1, has 4 out of 12 story points completed.
This more granular approach reveals that the epic is actually 33% complete; rather than 50% complete, which we would have worked out from just the number of issues completed.
Hierarchy for Jira breaks this down simply so we can quickly see how the estimate at each level rolls up to the above level.
Generate a consolidated Jira epic progress report
Hierarchy for Jira offers a powerful feature to create a consolidated epic progress report:
- Click the 'Collapse' button at the bottom left of the interface.
- This action generates a condensed view, allowing you to assess the estimated progress of multiple epics at a glance.
The key advantages of this new consolidated view is that you can now:
- Sort epics by their rolled-up story point or time-tracking values.
- Quickly identify lagging epics in any project segment.
- Gain a clear view of all epic progress simultaneously.
The ability to sort epics by their estimated progress is only possible with Hierarchy for Jira, and isn't possible if you're only using Jira's built-in epic report or epic burndown report.
In our eyes, Hierarchy for Jira is a must-have app for fast-moving teams that need accurate reports in Jira.
Example #1: Measure epic progress with story points
One effective way to measure progress is with story points. They provide an accurate representation of work completed, making it simple to estimate timelines and facilitating better project planning.
Example #2: Measure epic progress with time-based metrics
Measuring epic progress with time-based metrics is helpful because it provides a concrete and easily understandable measure of progress. Project Managers can use it to manage resource allocation and ensure team members are capable of completing their workload on time.
If you're using time-based metrics, you can choose to measure progress against 'Original estimate' and 'Current estimate'. Select the 'Time-tracking' option in your settings, and you're ready to start tracking.
Want to take your time-tracking reports to the next level? Discover how in this blog post.
Embed your Jira epic report in Confluence
Sharing progress reports with your team is vital for visibility and collaboration. Hierarchy for Jira makes this easy by allowing you to embed epic progress reports directly in Confluence.
To get started, you'll use your saved filters to bring up any set of issues you like. For example, you might have a saved filter that brings up each epic in your initiative or even epics across multiple projects.
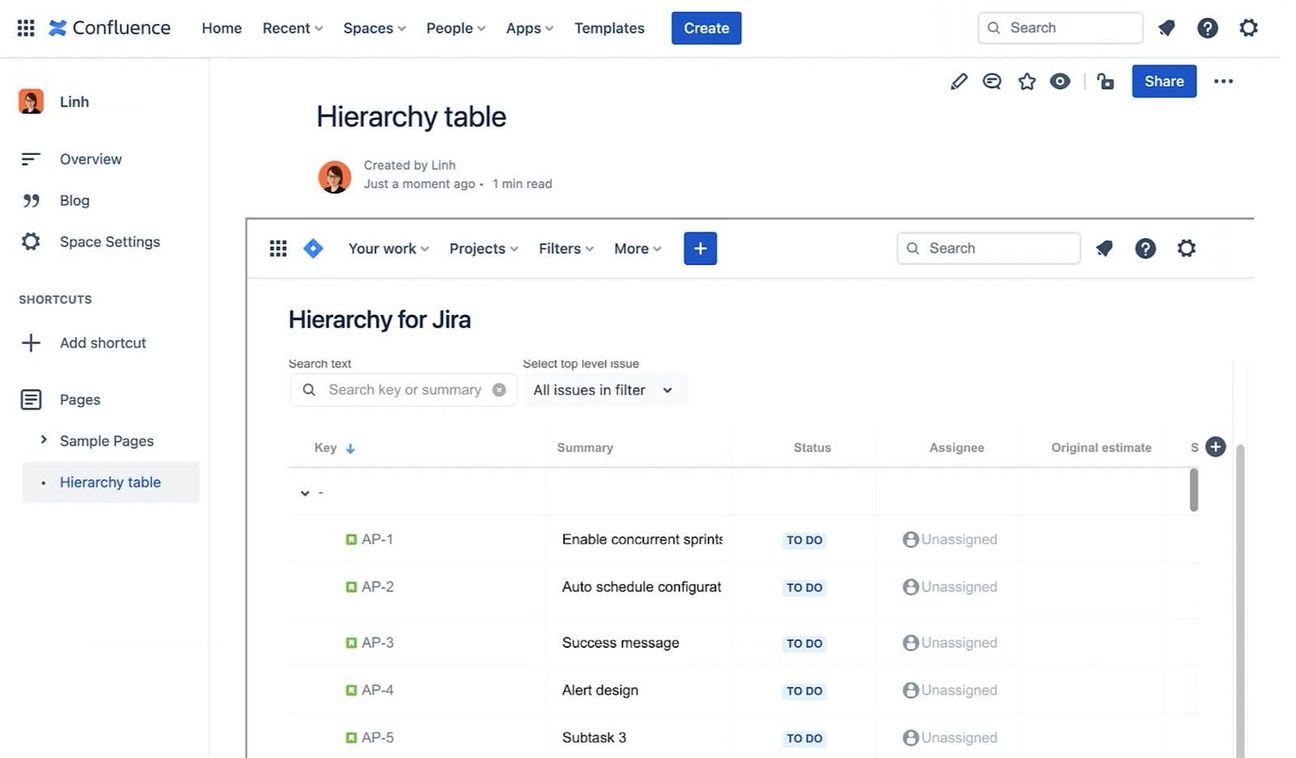
Once you're happy with your view, you can copy a link to that filter in Hierarchy for Jira and embed it in Confluence. This is perfect for sharing reports with stakeholders and other team members. You can even export your issues to a CSV to visualise them in Excel.
Need to share a visual schedule instead? Switch to Hierarchy for Jira's timeline view and generate a shareable URL or export a PNG snapshot.
Stakeholders can see your project timeline at a glance, complete with due dates, dependencies, and progress, without needing to navigate through individual epics.
Accurate reporting means better product decisions
For Project and Product Managers, the ability to track work accurately and in real-time is crucial. However, many people aren't fully leveraging Jira's powerful reporting capabilities, and that's where Hierarchy for Jira comes in.
Once you've installed Hierarchy for Jira, you'll start benefiting from:
- More accurate progress tracking.
- Consolidated views of multiple epics.
- Effortless sharing of reports through Confluence.
- Easy data-driven decision-making thanks to clear and easy-to-understand reports.
The best part?
You can try it at no cost with a completely free 30-day trial! Have a team of ten people or fewer? Use it free forever!
Ready to elevate your reporting in Jira?
Try Hierarchy for Jira today to see how it can help you leverage the full power of Jira for your project management needs.
Written by
Product Marketing Manager
Wilson is the former Product Marketing Manager for Hierarchy for Jira at Upscale. With a deep passion for being the voice of the customer and understanding market trends, he thrives on discovering new and innovative use cases for Hierarchy for Jira, empowering users and ensuring their success with our app.
Jira
Project Management